Wages and Employment in the United States: How Pay, Jobs and Policy Connect
Use the Bureau of Labor Statistics for U.S. employment, unemployment, earnings, and inflation measures. Check the release date and definitions because the statistics describe different populations.
The federal minimum wage is $7.25 per hour for covered, nonexempt workers. Many states and localities require higher rates; check the current rate where the work is performed.
What do wages and employment actually measure?

Wages are payments for labor, commonly quoted per hour, day or month. A salary is typically a regular fixed payment; earnings may also include overtime, bonuses or other cash compensation. Employee benefits, social insurance contributions and paid leave affect total compensation even when they do not appear in base pay. Employer labor costs can therefore exceed take-home wages.
Employment refers to people engaged in work under the statistical definition, not only those with formal contracts. The labor force comprises employed and unemployed people actively seeking and available for work under the applicable survey rules. The unemployment rate is unemployed people divided by the labor force, whereas the employment-to-population ratio compares employed people with the relevant working-age population. The labor force participation rate shows the proportion of working-age people in the labor force.
A lower unemployment rate can conceal weak earnings. Someone who takes irregular informal work may count as employed despite wanting more hours. Hours worked, underemployment, job security and access to social protection help show whether jobs are improving.
How wages and employment are determined

In a simplified competitive labor market, labor demand from employers and labor supply from workers jointly influence the equilibrium wage and the number of jobs. Demand rises when firms can sell more output or workers become more productive. Supply changes with demographics, education, migration, care responsibilities and alternative income opportunities.
Real labor markets rarely behave like a single textbook market. Employers differ in bargaining power, workers face transport and relocation costs, and information about vacancies and pay is incomplete. Where a few employers dominate hiring, labor market monopsony can hold wages below workers' contribution to production. Collective bargaining, minimum wage rules and enforcement may change outcomes under these conditions.
An industrial worker, a platform courier, a farm worker and a shop owner can all be employed, yet receive income in very different ways. A single national wage figure cannot describe their hours, benefits or bargaining power.
Does raising wages increase or reduce employment?
A pay rise can change hiring, hours, prices, profits and staff turnover. A factory with thin margins may delay recruitment; a firm struggling to retain workers may benefit from lower turnover. More income in workers' hands can also increase local spending. The outcome depends on the sector and the size of the increase.
Average earnings, median wages, employment, and unemployment are different measures. Read the survey definition and coverage before comparing groups or periods.
A national figure can hide major differences by occupation, industry, hours, region, and worker classification. Compare like-for-like jobs and locations.
Five adjustment channels worth checking
- Headcount: are firms creating or eliminating positions?
- Hours worked: is monthly income changing even when the number of workers is stable?
- Prices and profits: who absorbs higher labor costs?
- Productivity and turnover: do training, retention and organization improve?
- Formalization: are jobs shifting between registered and informal arrangements?
Counting jobs alone misses changes in hours, outsourcing and job stability. Average wages may also rise because lower-paid workers leave the measured group, even when nobody receives a raise.
How to read U.S. labor statistics

Nominal pay is the dollar amount received; real pay adjusts for inflation. The BLS Consumer Price Index tracks average price changes, not each household's personal costs.
For a job offer, compare take-home pay, expected hours, benefits, commuting and housing costs, and the applicable local wage floor.
A minimum wage is a legal floor for covered work; a living-wage estimate is a separate measure based on a chosen household budget. They answer different questions.
Minimum wage versus living wage
Employment statistics count work and job-seeking under defined survey rules. A low unemployment rate does not by itself show that jobs pay enough or provide stable hours.
Why real wages matter more than nominal raises
The federal minimum wage under the Fair Labor Standards Act is $7.25 per hour for covered, nonexempt workers. Many states and localities set higher rates, and coverage or exceptions can vary. Check the U.S. Department of Labor and the relevant state or city labor agency for the work location and date.
State and local labor agencies can explain wage rules that differ from the federal baseline. Coverage, tipped-work rules, and exemptions may affect the result.
Productivity, growth and sustainable wage gains

Long-run wage growth is easier to sustain when labor productivity—output per worker or per hour—rises. Better machinery, infrastructure, skills, management and technology can increase value added. However, productivity growth does not automatically pass through to employees: bargaining power, market concentration, labor institutions and profit distribution influence the split.
For employers, the practical comparison is total compensation cost against output, vacancy-filling time and staff turnover. For policymakers, relevant measures include real median earnings, productivity per hour, formal employment, youth transitions and the wage share of national income—not GDP alone.
Who faces the greatest wage and employment risks?
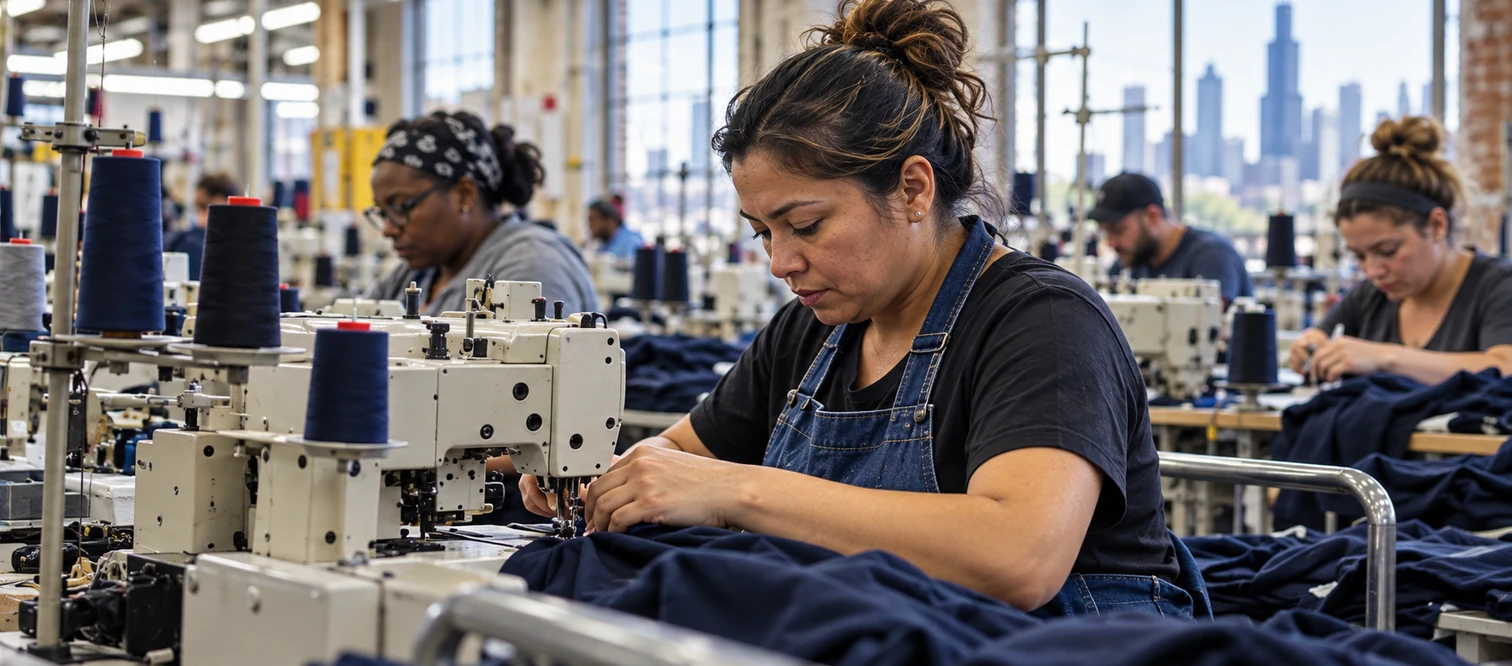
Informal and vulnerable workers
Informal employment may provide income when formal vacancies are scarce, but workers often have less predictable earnings, weaker contract protection and uneven access to social insurance. Self-employed workers and unpaid family workers are also not well described by average employee wage figures. Improving job quality requires attention to stability, safety, hours, legal rights and access to benefits as well as wages.
Young workers and skills mismatch
Youth employment is shaped by school-to-work transitions, work experience, recruitment requirements and access to training. A mismatch between workforce skills and employer demand can coexist with unemployment and unfilled vacancies. Apprenticeships and vocational programs should be assessed by placement, retention and subsequent earnings rather than enrollment alone.
Women and wage inequality
The gender pay gap may reflect differences in occupation, hours, seniority, care responsibilities, discrimination and unequal access to advancement. An unadjusted gap is not by itself a measure of discrimination. Wage distribution, the share of low-wage workers and differences between urban and rural areas are also necessary for understanding income inequality and poverty risks.
Collective bargaining, pay transparency, childcare and enforcement against discrimination can affect pay and participation. Results depend on how many workers are covered and whether rules are enforced.
Policy choices and trade-offs
| Policy instrument | Potential benefit | What must be monitored |
|---|---|---|
| Minimum wage and wage regulation | Higher pay for covered low-wage workers | Compliance, hours, hiring, prices and informal displacement |
| Collective bargaining and labor rights | Stronger worker voice and wage transparency | Coverage, firm capacity and enforcement |
| Training and active labor market programs | Better matching and productivity | Verified job placement and earnings gains |
| Social protection and income support | Reduced vulnerability during job loss | Eligibility, adequacy, fiscal cost and work incentives |
| Investment and SME support | Firm entry, growth and new vacancies | Additional formal jobs, productivity and survival |
Decent work, as framed by the International Labor Organization (ILO), combines adequate earnings with safe and secure employment. Sustainable Development Goal 8 concerns decent work and economic growth, while SDG 10 concerns inequality. Wage policy should therefore be judged against real earnings, job security and coverage of informal workers.
Average wages and minimum wages are different
A wage change may affect hiring, hours, prices, turnover, and household spending. Effects vary by industry and local conditions, so examine more than headcount.
Check the publication period and population whenever comparing wage data. A change in the workers included in a survey can move an average without a raise for any individual.
A practical verification sequence
- Define the group: all employed people, paid employees, youth, women or formal-sector workers?
- Check the measure: monthly average, median, hourly earnings, real wage, unemployment or underemployment?
- Match the geography: national, state, county, or metropolitan area; do not apply one state's wage floor everywhere.
- Match the date: wage floors and survey figures change; use the same reference period.
- Look for distribution: average wages can rise while low earners stagnate.
- Check outcomes together: wages, hours, headcount, job quality and prices reveal different effects.
Practical examples: comparing two jobs and evaluating a wage policy
Job offer comparison. Offer A pays $18 per hour for a 40-hour week with predictable hours and health coverage. Offer B advertises $20 per hour but often requires longer shifts, changing schedules, and a more expensive commute. Before choosing, compare take-home pay after commuting costs, check overtime eligibility and pay, and review deductions and benefits. A higher advertised rate may not produce the better overall offer.
City minimum-wage increase. Suppose a city raises its minimum wage. Compare affected workers' inflation-adjusted hourly pay, total paid hours, job retention, and hiring with credible comparison areas over time. Track changes in prices, productivity, outsourcing, and hours. A before-and-after comparison alone cannot isolate the policy effect from inflation, demand changes, or seasonal hiring.
Frequently Asked Questions
The federal minimum wage under the Fair Labor Standards Act is $7.25 per hour for covered, nonexempt workers. Many states and localities set higher rates, and coverage or exceptions can vary. Check the U.S. Department of Labor and the relevant state or city labor agency for the work location and date.
Yes. More people may find work in low-paid sectors, working hours may decline, or inflation may outpace nominal pay. Employment quantity and real earnings should be assessed separately.
No. The effect depends on the size of the increase, employer market power, compliance and how firms adjust hiring, hours and prices. Studies reach different conclusions across labor markets.
Someone doing a small amount of paid work may count as employed while earning too little or wanting additional hours. Informal employment and underemployment can coexist with a relatively low open unemployment rate.
Use BLS data to describe labor-market outcomes and Department of Labor guidance to check legal wage requirements; do not use one source as a substitute for the other.
Read Similar Articles
A comprehensive review of statutory workplace protections, wage theft prevention, safe working conditions, and remedies.
Learn More
Tracing union organizing, collective bargaining victories, and worker-led solidarity in modern post-industrial economies.
Learn More